Valmonte Real Estate: How Often Do Homes Sell in Each Pocket?
How Often Does a Home Like Yours Sell in Valmonte?
And if you're a buyer, how often does an opportunity to purchase in your preferred Valmonte pocket actually appear?
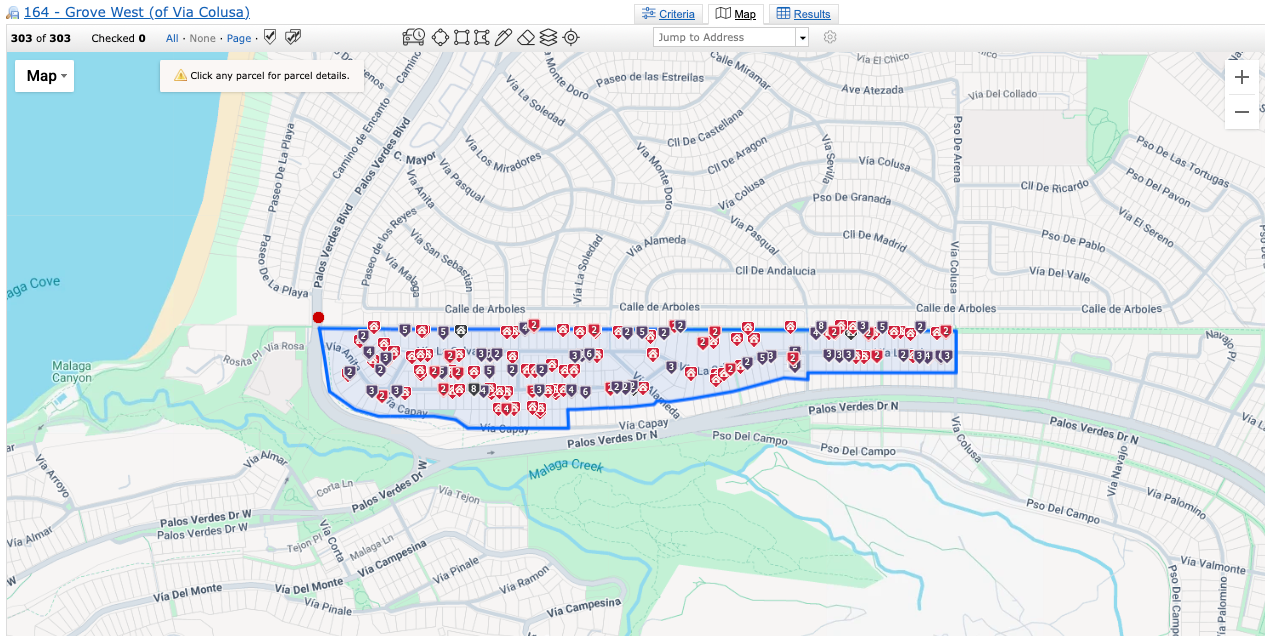
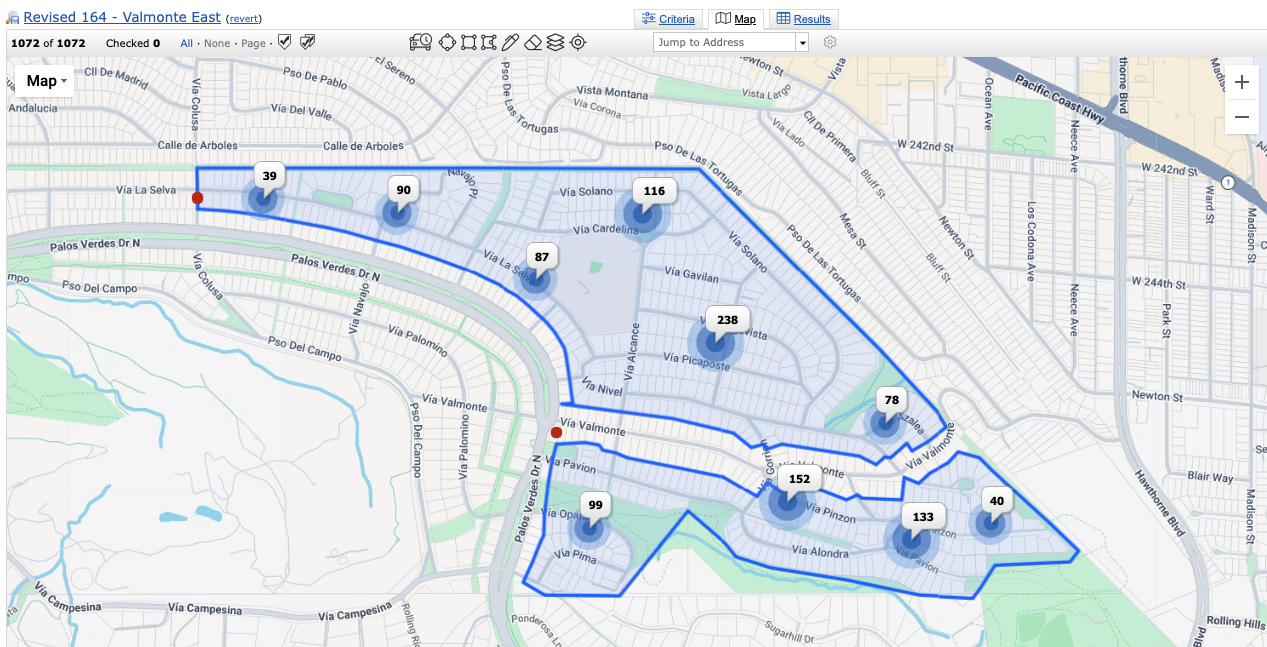
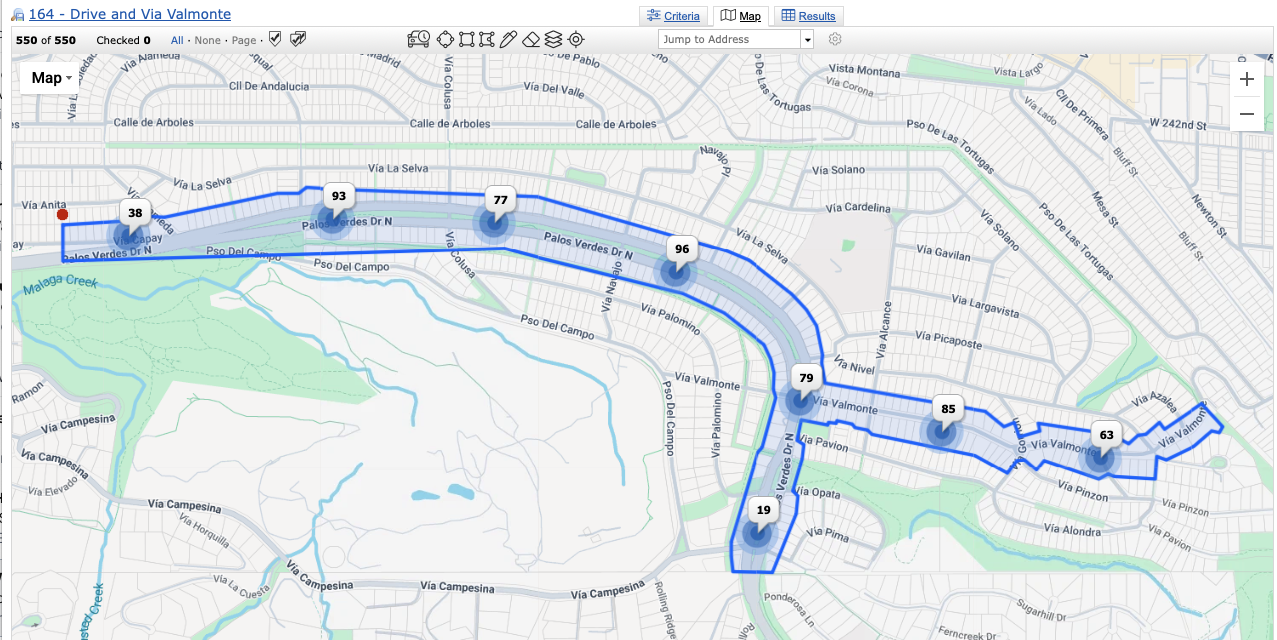
Valmonte may be one neighborhood, but it does not behave like one uniform real estate market. We reviewed sales from January 2016 through September 2026 and separated Valmonte into four practical micro-markets: the Grove, East Valmonte, Via Valmonte & Palos Verdes Drive North, and the Golf Club Adjacent pocket.
The analysis produced two sides of the same scarcity question. For a homeowner: how often does a home in my pocket actually sell? For a buyer: how frequently does an opportunity to buy there historically appear?
Scarcity Looks Different Depending on Which Side of the Transaction You're On
For a homeowner, turnover helps answer how often another home in the pocket competes for buyers. For a buyer, the same sales history tells us how frequently an opportunity has historically appeared.
Cliff's Notes: The Simple Version
Those are opportunities to buy any home in the pocket. Once a buyer asks for the right bedroom count, size, lot, floor plan, condition and street location, the number of genuinely suitable opportunities can become dramatically smaller.
How Often Do Valmonte Homes Actually Turn Over?
Most market reports tell you how many homes sold. Turnover asks a more useful question: how much of the housing stock actually trades in a typical year?
How Often Does a Home Sell?
These estimates compare average annual sales from January 2016 through September 2026 with the approximate number of homes inside each mapped pocket.
Valmonte Grove
~1 in 34 homes per year Approximately 3% annual transaction turnover.East Valmonte
~1 in 20 homes per year Approximately 5% annual transaction turnover.Via Valmonte & PVD North
~1 in 25 homes per year Approximately 4% annual transaction turnover.Golf Club Adjacent
~1 in 25 homes per year Approximately 4% annual transaction turnover.In the structured decade data, the 60 Grove transactions represented approximately 52 different addresses. In the Golf Club Adjacent pocket, 47 transactions represented approximately 41 different addresses.
That distinction matters. Counting transactions alone can make a neighborhood appear slightly less scarce than it really is because some of the activity comes from the same properties selling more than once.
For a homeowner, the important number isn't simply how many sales occurred. It is how many different homes became available, how large the pocket is, and how many of those properties actually resembled yours.
If You Want to Buy in One of These Pockets, How Often Does an Opportunity Appear?
We can turn the same decade of sales into a buyer-friendly statistic: Buyer Opportunity Frequency.
Rather than saying a buyer has a certain percentage "chance" of finding a home — which would imply more certainty than the data supports — we can measure how frequently a sale historically occurred in each pocket.
How Long Between Historical Opportunities?
This is the average spacing between recorded sales across the entire pocket during the January 2016 through September 2026 study period.
East Valmonte
~23 days between historical sale opportunitiesVia Valmonte & PVD North
~37 days between historical sale opportunitiesValmonte Grove
~65 days between historical sale opportunitiesGolf Club Adjacent
~83 days between historical sale opportunitiesAverage Time Between Sales
Shorter bars represent more frequent historical opportunities. Longer bars represent greater scarcity.
An "opportunity" does not necessarily mean a home you would actually want to buy.
The figures above include every recorded sale in the pocket. A buyer may be searching for something much more specific: perhaps four bedrooms, 2,500+ square feet, a quiet interior street, a usable yard, single-level living, a particular school location, updated condition or a certain price range.
Only a fraction of the historical sales may satisfy those requirements.
So while the Golf Club Adjacent data suggests a home sold somewhere in that pocket about once every 83 days on average, the wait for a specific type of Golf Club Adjacent property could be considerably longer.
The same applies to the Grove. Roughly one Grove transaction every 65 days does not mean a buyer seeking a four-bedroom, single-level home on a quiet street sees six suitable homes every year. There may be years when only one or two homes satisfy that narrower definition.
The buyer question isn't simply, "How often does a Valmonte home come up?" It is, "How often does the kind of Valmonte home I would actually buy come up?" That's where scarcity becomes much more meaningful.
Buyer Opportunity Frequency is calculated from average historical sales activity and is not a prediction of when the next home will be listed. Sales do not occur at evenly spaced intervals: several homes may trade within a short period followed by months with little or no suitable inventory.
Why Divide Valmonte Into These Four Areas?
These are not official municipal subdivisions. They are practical real estate groupings based on the way the neighborhood changes as you move through it.
Valmonte is unusually interesting because its geography changes over a relatively short distance. Tree canopy, road exposure, access toward the beach, proximity to the golf course, lot characteristics and street layout can all change within a few blocks.
Valmonte Grove
Mature trees, character, interior streets and strong connectivity toward the Hollywood Riviera.
Tree canopy Interior streets Riviera accessEast Valmonte
A broader network of cross streets and residential blocks with a classic neighborhood feel.
Neighborhood grid Cross streets Varied housingVia Valmonte & PVD North
Valmonte's major travel corridors, where convenience and accessibility meet greater road exposure.
Accessibility Traffic Road exposureGolf Club Adjacent
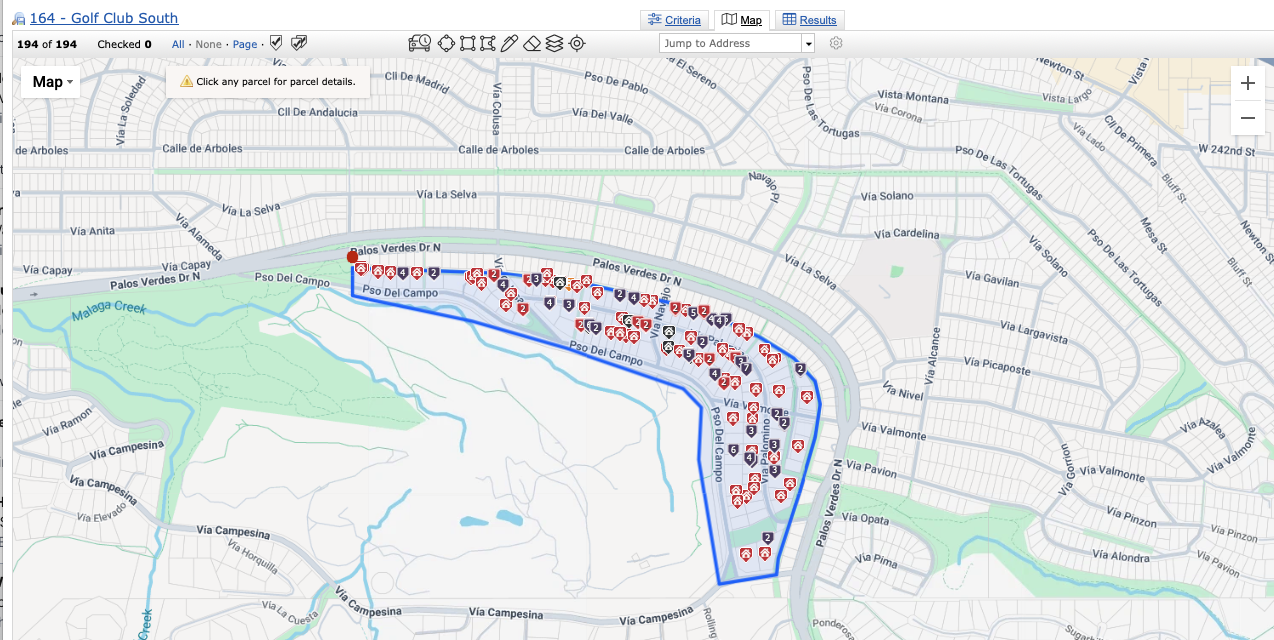
The western pocket influenced by the Palos Verdes Golf Club, greenery, open space and generally larger housing.
Golf proximity Greenery Larger homesThe Four Valmonte Pockets Side by Side
The table below brings both sides of scarcity together: how frequently homes turn over relative to the housing stock and how frequently a historical buying opportunity appeared somewhere within the pocket.
| Sales Reviewed | Approx. Sales / Year | Annual Turnover | Buyer Opportunity Frequency | Median Sale Price | Median Home Size | Median $ / Sq. Ft. | |
|---|---|---|---|---|---|---|---|
| Valmonte Grove | 60 | ~5.6 | ~1 in 34 homes | ~Every 65 days | ~$2.06M | ~2,278 sq. ft. | ~$933 |
| East Valmonte | ~169 | ~15.7 | ~1 in 20 homes | ~Every 23 days | ~$1.84M | ~2,024 sq. ft. | ~$897 |
| Via Valmonte & PVD North | ~108 | ~10.0 | ~1 in 25 homes | ~Every 37 days | ~$1.68M | ~1,957 sq. ft. | ~$814 |
| Golf Club Adjacent | 47 | ~4.4 | ~1 in 25 homes | ~Every 83 days | ~$2.55M | ~2,544 sq. ft. | ~$996 |
Notice the difference between turnover and opportunity frequency. Two pockets can have similar annual turnover percentages but very different numbers of opportunities because one pocket contains many more homes. That's exactly what we see when comparing Via Valmonte/PVD North with the smaller Golf Club Adjacent pocket.
Valmonte Grove: Trees, Character and Lower Turnover
If one feature visually defines the Grove, it is the mature tree canopy.
This western and central tree-oriented portion of Valmonte includes some of the neighborhood's most recognizable streets as well as several tiny hidden streets. Mature eucalyptus, established landscaping, trails and residential streets can make parts of the Grove feel unusually secluded for the South Bay.
The 60 transactions represented approximately 52 different addresses in the structured MLS data. Repeat sales therefore account for part of the decade's activity.
A buyer historically saw only about five or six Grove sales per year across the entire pocket. Narrow that search to a particular floor plan, size, lot or street setting and truly comparable opportunities can become considerably rarer.
East Valmonte: The Classic Neighborhood Pocket
East Valmonte feels less like a corridor or enclave and more like a network of residential streets.
Numerous cross streets, short connectors, cul-de-sacs and interior residential blocks give this part of Valmonte a traditional neighborhood quality. It also contains a broad range of housing built, expanded and remodeled over many decades.
East Valmonte produced the greatest overall opportunity frequency in the study. But because the pocket is also larger and more diverse, a buyer's relevant inventory can become much smaller after narrowing by street, home size, usable lot, floor plan, condition or view orientation.
Via Valmonte & Palos Verdes Drive North: Accessibility With a Trade-Off
Via Valmonte and Palos Verdes Drive North are fundamentally different from Valmonte's quieter interior streets because they also function as routes through the neighborhood.
They provide excellent connectivity, while traffic, driveway access, front-yard privacy, landscaping and setback can influence buyer perception.
There have historically been more buying opportunities along these corridors than in the Grove or Golf Club Adjacent pocket, but the individual property's relationship with the road becomes especially important when comparing those opportunities.
Golf Club Adjacent: Larger Homes, Greenery and Fewer Opportunities
The Golf Club Adjacent pocket stands apart for larger housing and relatively few transactions.
This portion of Valmonte is influenced by the Palos Verdes Golf Club and surrounding greenery. Depending on the exact property, buyers may respond to golf-course proximity, open outlooks, mature landscaping, privacy, view potential and larger lots or homes.
Those 47 transactions represented approximately 41 different addresses in our structured data.
The median sold home was approximately 2,544 square feet — roughly 266 square feet larger than the Grove median, about 520 square feet larger than East Valmonte and almost 590 square feet larger than the Via Valmonte/PVD North corridor sample.
A buyer specifically targeting this pocket historically saw only about four or five total sale opportunities per year — and that is before specifying home size, condition, lot, views or floor plan.
The Real Question: How Often Does a Home Like Yours Become Available?
This is where the buyer and seller sides of the analysis come together.
Comparable Supply
A four-bedroom, single-level home on a quiet interior street with a usable yard does not compete equally with every four-bedroom Valmonte home.
Once we match the pocket, street position, home size, lot, floor plan, condition, architecture and buyer profile, the number of true alternatives can fall quickly.
A buyer might historically see a home sell somewhere in East Valmonte every few weeks. But if that buyer wants a 2,500-square-foot single-level home on a quiet interior street with a good yard, the relevant opportunity frequency could be far lower.
This is the same scarcity dynamic explored in our Valmonte Inventory & Scarcity Report, which examined what 43 sales during 2025 revealed about available housing across the broader neighborhood.
For buyers, the question is how long they may need to wait for another suitable opportunity. For sellers, the question is how easily a buyer can replace their home with something else. They are two ways of measuring the same thing: scarcity.
Find Your Valmonte Street
The pocket is useful context. The individual street is where Valmonte real estate becomes truly local.
Every street button below connects to the existing Scherb Homes Group street guide for that location. Some streets sit near the transition between two micro-markets, so these groupings describe the dominant real estate environment rather than official neighborhood boundaries.
Valmonte Grove
The tree-oriented Grove and its smaller hidden streets, with strong neighborhood character and convenient access toward the Hollywood Riviera.
East Valmonte
A larger network of cross streets, short residential connectors and neighborhood-oriented blocks.
Via Valmonte & Palos Verdes Drive North
The two principal through-corridors in this study, where access, traffic, setback and privacy become especially important valuation considerations.
Golf Club Adjacent
Streets and portions of streets influenced most directly by the golf course, open-space setting, mature landscaping and western Valmonte location.
Some Valmonte streets have more than one personality.
A long street can cross from one environment into another. Via Valmonte is the clearest example: portions feel like a busier neighborhood corridor while other sections approach the golf course and take on a more open, estate-oriented character.
For that reason, the exact block, side of the street, setback, elevation and surrounding homes can matter just as much as the street name itself.
The complete Valmonte Streets A–Z resource brings every Scherb Homes Group street guide together in one place.
Explore Every Valmonte Street A–ZInteractive Valmonte Street Map
The street names make more sense when you can see how they fit together.
Use the Scherb Homes Group interactive Valmonte map below to explore individual streets, neighborhood geography, local destinations and the relationship between Valmonte and the surrounding Palos Verdes and South Bay communities.
Scherb Homes Group Valmonte Map
Valmonte Turnover, Scarcity & Buyer Opportunity FAQ
What does Buyer Opportunity Frequency mean?
Does one opportunity every 23 days mean a home will be listed every 23 days?
What are my chances of finding a home in Valmonte?
Which pocket historically produced the most buying opportunities?
Which pocket historically produced the fewest buying opportunities?
What does "1 in 25 homes sells each year" mean?
Does lower turnover automatically make a home more valuable?
How can I find out how often a home like mine sells?
How Rare Is the Home You're Selling — or Trying to Buy?
Whether you're considering selling a Valmonte home or waiting for the right one to become available, I can take this analysis from the neighborhood level down to the exact pocket, street, property type and comparable set.